Methods for quantitative data
There are many ways to pseudonymize quantitative data and it is always you as a researcher who are best equipped to determine which methods are most suitable for your research data. Below are some general tips and commonly used techniques for pseudonymizing quantitative research data.1
10 tips for working with quantitative data
1. Use statistical software with scripting capabilities
When pseudonymizing research data, it is important to document what you are doing – for your own reference and for potential secondary users. Use a statistical tool that allows you to document your transformations using a script.
2. Never work on the original data
You will likely have to experiment and refine your methods to find a solution that fits your needs. Therefore, you should always work on a copy of your data instead of on the original data to avoid any irreversible loss of important information.
3. Start with direct and indirect identifiers
Always begin by identifying and addressing direct (e.g., names) and indirect identifiers (e.g., age, location) first. Prioritize the variables that most reduce the risk of re-identification.
4. Tabulate and visualize your data
By tabulating and visualizing combinations of variables, you gain an overview of the distribution of your observations. Identify outliers or unique observations that may increase the risk of re-identification. Assess whether these observations can be recoded (e.g., grouped into broader categories), or should be removed entirely.
5. Review all free-text responses
If your research data include free-text or other open-ended responses or comments, review them carefully. Free-text responses may contain directly or indirectly identifying information about the respondent or third parties. A good starting point is to mark potentially identifying information in [square brackets] to flag it for masking, recoding, or removal.
6. Be consistent
Apply the same pseudonymization strategy consistently across all datasets. Avoid making separate solutions for parts of the material, or for individual datasets in a series. Using different approaches within the same project may not only be confusing but could increase the risk of re-identification.
7. Review background material
Review any documentation or other background material associated with your research data – such as sampling details, contact lists, or method descriptions – for identifying information. Ensure that the material does not contain any accessible code keys and that method descriptions and metadata do not contain details that could directly or indirectly identify a participant.
8. Evaluate the outcome
Verify that your protective measures effectively protect the participants’ identities. Test whether individuals can still be identified using reasonable effort and check whether there are any external data sources that could be used for re-identification.
9. Create a codebook
Document how you have recoded or altered variables and information in the dataset. If you are using scripting software (see 1 above), the script itself can often serve as a codebook.
10. Avoid collecting personal data unless necessary
If you plan to make your data publicly available, carefully consider which personal data you need to collect. In most cases, personal data, even if indirectly identifying, cannot be shared openly, and research data – including personal data – may not be deleted unless a formal disposal decision has been made and the retention period has expired. (For more information, see the section on legal aspects.)
Sometimes it may be necessary for the research question to collect personal data; in other cases, it is not necessary. Remember that personal data include both directly identifying information and any information that can indirectly and together with additional data identify an individual. For example, if you do not plan to collect direct identifiers like names or personal ID number but want to collect age and income data, consider using ranges instead of exact values (e.g., age 18–29 or 30–39; income <£2,000, £2,001–3,000) to reduce the risk of re-identification.
Common methods for quantitative data
The most common way to pseudonymize quantitative data is by applying various statistical techniques. These approaches modify the dataset to make it difficult – or impossible – to identify individual research participants. Broadly speaking, statistical pseudonymization techniques fall into two categories:
- Generalization: Reducing the level of detail, or granularity, in the data to obscure the identity of individuals. This is often done by recoding variables into broader categories, making the information less specific. A common example is converting specific ages or dates of birth into age brackets.
- Randomization: Replacing values in the dataset with randomized alternatives, making it difficult to trace information back to individuals. This typically involves changing the values of indirect identifiers at random or swapping values between observations in the dataset.
Methods using generalization
1. Remove direct identifiers
You should always remove direct identifiers (such as names, personal ID numbers, and e-mail addresses) from datasets intended to be shared outside your organization. However, keep in mind that research data are considered official documents (allmän handling) and may not be deleted without a formal disposal decision and after a mandatory retention period (see the section on legal aspects).
It is also crucial to review any free-text responses before sharing data, as these may contain direct identifiers. This type of information is sometimes supplemented in an appendix to the main data files, which can result in overlooking it. For example, participants may include their names, e-mail addresses, or phone numbers when they provide feedback on a survey or leave their contact information for further questions.
Another risk is forgetting to remove direct identifiers from documentation such as sampling procedures, survey drop-out analysis, or methodological descriptions.
2. Recode variable values
One of the most common anonymization techniques is to recode variable values into broader categories or brackets. Through generalization and aggregation of specific variable values, you can significantly reduce the risk of re-identification. Typically, you begin with indirect identifiers such as age, income, occupation, or geographic variables such as town or municipality.
It may be difficult to aggregate extreme values or outliers (low or high) into the same categories as the rest of the data. In such cases, consider top- or bottom-coding – replacing extremes with threshold values (e.g., “65 and over” or “18 and under”).
How you recode background variables and indirect identifiers will depend on how the data will be used, what analyses you want to be able to make, and how openly you intend to share the data. It is helpful to follow established classifications and standards, such as those published by Statistics Sweden (SCB), to guide your recoding.
When should I use this method?
Use recoding as a first step to reduce the level of detail without losing all information. In some cases, recoding indirect identifiers will be sufficient; in others, more variables may need to be recoded if they can be combined to identify individuals in the sample.
Limitations and common mistakes
While recoding and generalizing variables in research data is an effective way to lower re-identification risk, it is rarely possible to achieve complete protection without significant loss of information. Even if individuals cannot be directly identified in the shared dataset, it may still be possible to distinguish many participants. This makes the method vulnerable to so-called inference attacks. You can read more about this in the article k-anonymity: A model for protecting privacy (PDF).
A common mistake is to forget to recode or remove extreme values and/or outliers. To identify them, tabulate and visualize your data to see which variables and combinations of variables stand out. You can also use k-anonymity to assess how well your transformations protect research participants (see 4, below).
3. Edit, recode, or remove free-text responses
The standard technique for pseudonymizing free-text responses is to recode, remove, or replace identifiable information with pseudonyms or aliases. The same principles apply as with pseudonymizing qualitative data. This could involve names, phone numbers, addresses, places of residence, next of kin, or information about third parties that could, in combination with other data, be used to identify an individual person. Another option is to recode free-text responses into categories for frequency rates or statistical analysis.
Create a consistent coding scheme in advance before starting the data collection, especially if you will work with large datasets or projects with several researchers. If you recode free-text responses, make code instructions with clearly described categories and criteria.
If you replace information with pseudonyms or aliases, you can use [square brackets] to mark information that has been changed. Document all changes in a code book, so that you can more easily understand the pseudonymized material and remove all information that is not relevant to your research question.
When should I use this method?
Always pseudonymize or remove potentially identifying information from free-text responses in datasets you plan to share outside of your organization.
Limitations and common mistakes
Pseudonymizing free-text responses is time-consuming and prone to errors, as it usually requires manual review. There is a higher risk of overlooking directly or indirectly identifying information compared to if you pseudonymize a numeric variable in structured data. Additionally, free-text responses often include contextual information that may appear harmless but can be linked to or cross-referenced with other data sources. A common mistake is to treat free-text responses as a separate and less sensitive part of the dataset, outside of the quantitative data.
To minimize the workload and decrease the amount of text in free-text responses, consider using web-based survey tools to limit the number of characters in free-text fields.
4. K-anonymity and other methods for assessing re-identification risk
K-anonymity is a statistical concept and technique used to assess how well you have pseudonymized tabular data in quantitative datasets. It measures how many individuals in the data who share the same combination of attributes, which is an indication of the risk that an individual can be re-identified in a dataset.
When you recode background variables by grouping individuals with similar background variables in the data into broader categories, you create “data twins” with the same attributes who become almost impossible to distinguish from the population. k-anonymity provides a measure of how many individuals in a group share the same attributes, or how many data twins there are in a dataset. For example, k=10 means that there are at least ten individuals with each combination of variables. A higher k value means that each set of attributes is shared by more persons, reducing the risk of distinguishing a single individual from the population.
Video explaining k-anonymity.
How high the k value needs to be depends on what the dataset contains, how easy it can be linked to additional data sources, and how sensitive the information is. A higher k value signifies better protection, but it generally also means greater information loss. Remember that k-anonymity is only one of several methods for pseudonymizing data.
There are several digital tools for calculating k-anonymity; we have collected some of them under Tools. You can also calculate k-anonymity in a statistics program, for example R or Stata, as shown in the video below.
Video showing how to apply k-anonymity in Stata and R.
When should I use this method?
Use k-anonymity to assess whether the pseudonymization measures of a tabular dataset are sufficient. k-anonymity provides an indication of whether you need further protective measures before sharing the data.
Limitations and common mistakes
K-anonymity and other statistical methods only account for the processed data and the variables included in the analysis; it ignores contextual factors that can pose a re-identification risk, such as external data sources or data storage environments.
A common error is to not include all indirect identifiers in the k value calculation. Unless all potentially identifying variables are included in the calculation, the result will be misleading. Another mistake is to overlook the variation within variables with other sensitive attributes that are not included in the analysis; meaning that you cannot know for sure whether the data are safe to share based on the k value. The k value also does not mean that the dataset is anonymous from a GDPR perspective.
The greatest limitation for k-anonymity is that it does not offer protection against inference attacks. Even if you cannot immediately identify an individual in the material, it might still be possible to distinguish a unique observation in the dataset despite a high k value, and that way deduce an individual’s identity from context.
Moreover, k-anonymity does not measure how other sensitive attributes in the dataset are distributed within a group during recoding. Even if you include all indirect identifiers in your calculation of the k value, there may be other variables with sensitive information that are distributed so that you can connect unique individuals to attributes by linking data sources. You can read more about how to manage the limitations with k-anonymity below.
When k-anonymity is not enough
One way to address the limitations with k-anonymity is to use an extended method of the same concept, l-diversity. L-diversity adds further protection by measuring the variation, or diversity, within specific variables of each group created when recoding the data.
L-diversity is calculated in the same way as k-anonymity, but the other way around. For example, l=3 means that there are three distinct attribute values within a k-anonymous group. It is, unlike k-anonymity, an assessment of the heterogeneity of a variable. L-diversity is a helpful measure to clarify different risks that k-anonymity does not account for. In reality, it may be difficult to apply l-diversity without significant data loss.
There are several digital tools for calculating l-diversity; we have compiled some of them in the Tools section of this guide.
Video with a simple explanation of l-diversity.
Another refinement of this technique is t-closeness, which is used when even l-diversity is insufficient.
Video with a simple explanation of t-closeness.
Methods using randomization
1. Noise addition
Noise addition involves introducing random variation into the dataset to make it more difficult to identify individuals. This can be done in several ways – for example, by randomly altering values for certain attributes or by swapping individuals within the dataset. The purpose is to obscure links between data points and specific individuals, thereby reducing the risk of re-identification.
When should I use this method?
Noise addition is often used in combination with other pseudonymization techniques, especially when dealing with sensitive data. It is particularly useful when you want to retain the data’s overall structure. For example, randomly changing participants’ ages by ±3 years typically does not affect statistical analyses significantly but offers increased protection against re-identification.
Limitations and common mistakes
Adding random variation or noise to the data does not provide absolute protection against re-identification. If the added variation is minimal, it may still be possible to match specific observations with external data sources. A higher degree of random variation can lower the risk of re-identification, but adding too much variation may lead to such information loss that the data no longer support the research questions.
In some cases, random noise may lead to artificial or false re-identification. This happens when the noise creates variable combinations that can be linked to real individuals through external data sources.
A well-known example where noise addition failed was demonstrated in 2008, when two researchers managed to identify 99% of Netflix users by linking movie ratings to Amazon reviews and users, even though Netflix had applied random variations on their data. See more about this in the video in the section about differential privacy below.
A detailed account of this case and the methods behind the de-anonymization of Netflix users can be found in the report Robust De-anonymization of Large Sparse Datasets (PDF).
2. Permutation
Permutation is a type of noise addition where existing values in one variable are shuffled within the same dataset, rather than replaced with new random values. In a quantitative, tabular dataset, this means that values are shuffled and reassigned within a column. For this reason, permutation is often used when it is desirable to preserve the original distribution in a dataset. By swapping values within a variable (or column), the variable’s variation or distribution is preserved, but the correlation between variable and individual is broken.
Permutation is best suited for variables that are not strongly correlated with others, to avoid excessive information loss. For example, if two attributes like income and occupation are strongly correlated and one of them needs to be pseudonymized, it may be better to choose another method instead.
When should I use this method?
Permutation should generally be used alongside other pseudonymization techniques. It is useful when you want to maintain the distribution of values, or preserve the values of some variables, while reducing re-identification risk. However, it should not be used for multiple variables that are highly correlated, as this can make the data unusable due to information loss.
Limitations and common mistakes
As with other forms of noise addition, permutation does not guarantee full protection against re-identification. How effective it is depends on which variables whose values are shuffled, or permuted. If you do not include enough indirect identifiers in the permutation, individuals may still be re-identifiable.
A common mistake is to shuffle variables at random without considering their correlation with other variables in the dataset. For example, if income is permuted but still closely correlates with occupation, it may still be possible to infer who in the dataset has which income.
3. Differential privacy
Differential privacy is another noise addition method and is used to analyze the trade-off between privacy and information loss. The basic principle is the same: random variation is introduced into the dataset to prevent specific responses from being linked to individuals. The key difference lies in scale and application.
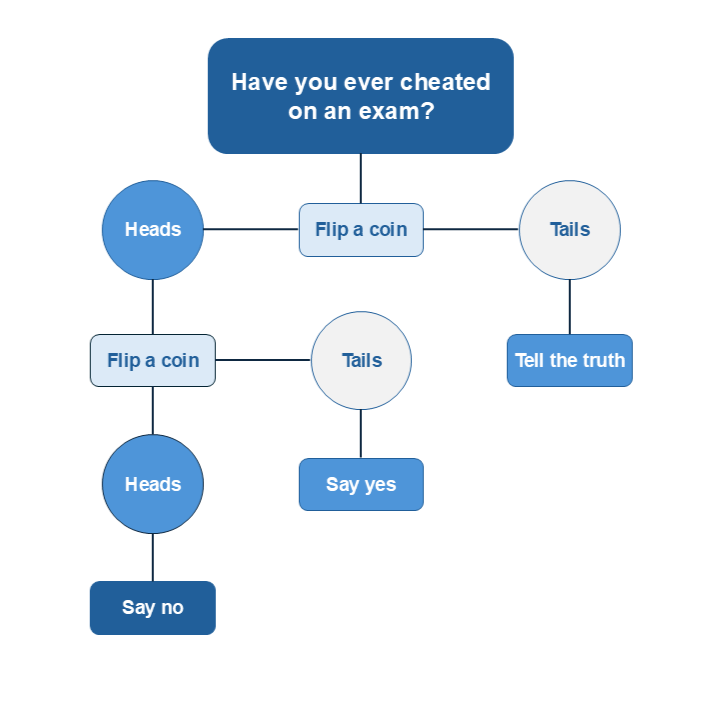
A simplified analogy is flipping a coin. In a research context, differential privacy might mean that participants’ answers are randomly altered according to a known probability distribution (see the figure below). While this may seem counterintuitive, if the dataset is large enough, the added randomness evens out potential asymmetries in the distribution, and the data can still be used for analysis and realistic predictions even though the responses are randomly distributed.
Differential privacy is generally applied only to exceptionally large datasets (“big data”), where random noise has limited impact on results due to the high number of observations. The advantage with differential privacy is that, if the dataset is large enough, researchers can still perform meaningful analyses while maintaining a high level of privacy protection. However, this method is unsuitable for small datasets, where random changes can significantly distort the results.
You can learn more about how to apply differential privacy in practice with Python coding in the guide A differential privacy example for beginners:
Video with a simple explanation of differential privacy.
When should I use this method?
Differential privacy should only be considered when working with exceptionally large datasets. It is not suitable for small-scale studies.
Limitations and common mistakes
As mentioned, differential privacy shares some of the same limitations as other noise-based methods, depending on how it is applied. However, it is often regarded as one of the more advanced and secure options available for data pseudonymization.
The greatest challenge with differential privacy is determining the appropriate amount of noise to add to the actual responses. Too little may not protect the participants' privacy, while too much may render the data unusable.
References
1. The information on this page is partly based on information from Data Management Guidelines [Online]. Tampere: Finnish Social Science Data Archive [distributor and producer]. < https://www.fsd.tuni.fi/en/services/data-management-guidelines/anonymisation-and-identifiers/#anonymisation-of-quantitative-data> (Retrieved 2025-06-02.)